HierCC (Hierarchical Clustering of CgMLST)
Hierarchical Clustering of CgMLST (HierCC) defines clusters based on cgMLST. Distances between genomes is calculated using the number of shared cgMLST alleles and genomes are linked on a single-linkage clustering criteria. These clusters are assigned stable cluster group numbers at different, fixed cgMLST allele distances. Salmonella for instance, has cut-offs such as 1, 2, 5, 10, 20, 50, 100, etc.
HierCC Methods
Construction of Hierarchical Clustering scheme for cgMLST (HierCC)
Hierarchical clustering schemes in EnteroBase were initially developed as sets of sub-trees of a minimum spanning tree (MSTree) constructed of all the cgMLST STs. In particular, in order to minimize the effect of missing data, the genetic similarity of STs that were used to infer the MSTree was defined as the number of shared core genomic alleles. Then for a cgMLST scheme with D loci, given any cutoff value d<D, a set of sub-trees can be obtained from the MSTree, by removing allele the branches that were more distant than d from the tree. A maximum of D sets of sub-trees were obtained by alternating d from 0 to D-1, which are designated as hierarchical clustering levels of HC0 to HC(D-1).
Identification of stable HierCC levels using Silhouette index, Shannon index and normalized mutual information score
We searched for stable levels of differentiation by HierCC according to the Silhouette index, a measure of uniformity of the divergence within clusters.
The Silhouette index was calculated based on d’, a normalized genetic distance between pairs of STs, which was calculated from their allelic distance d as: d’=1-(1-d)(1/l), where l is the average length of the genes in the cgMLST scheme.
We further evaluated the “stability” of hierarchical clustering using two other criteria.The Shannon index is a measure of diversity in a given population. The Shannon index drops from nearly 1 in HC0, because most cgSTs are assigned to a unique HC0 cluster, to 0 in the greatest HC level, which assigns all sequence types to one cluster. The gradient of the Shannon index between the two extremes reflects the frequencies of coalescence of multiple clusters at a lower HC level. Thus, the plateaus in the curve correspond to stable hierarchical levels, where the Shannon index does not change dramatically with HC level. We also evaluated the stability of hierarchical clustering by pairwise comparison of the results from different levels based on the normalized mutual Information score.
Finally, candidate stable HierCC levels were visually inspected and confirmed by mapping their clusters onto a neighbour-joining tree of representative genomes.
Static HierCC designations in EnteroBase
A new coming genome was compared to each of the existing genomes in EnteroBase by counting the differences in all the loci that were present in both genomes to identify a nearest neighbor. When there are multiple neighbors of equally smallest distances, the neighbor with the smallest ST designation will be chosen. The new genome was then assigned into the same HierCC group as its neighbor, if the cutoff for a HierCC level was equal or greater than its allelic distance to the neighbor. Once a genome was genotyped and assigned into HierCC levels, its designations became static unless major modification of HierCC algorithm was proposed.
How to use HierCC
HierCC is another experimental data result, just like 7 gene MLST. Viewing these results are available through the Experimental Data dropdown. We will use an example of Salmonella Typhimurium ST 313 from Malawi to illustrate this. To search for the relevant strains do the following:
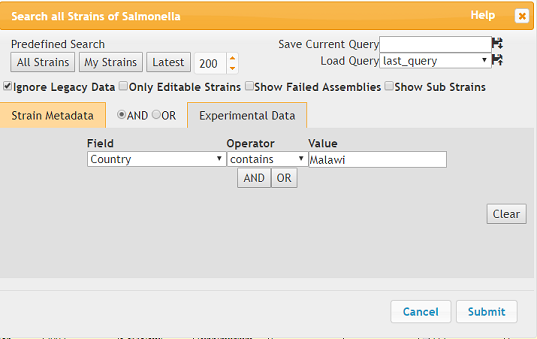
Use Search strains
Under Strain Metadata: Country should contains ‘Malawi’.
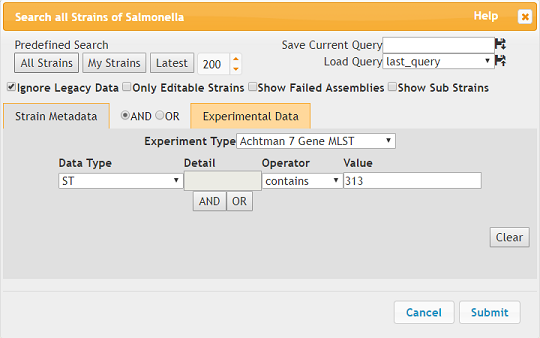
Under Experimental Data:
Experiment Type should be 7 Gene MLST
Data Type should be ST where ST contains ‘313’.
Ignore legacy data should also be checked.
Click Submit
The search results can be seen here. To specifically look at the HierCC data:
Under Experimental Data: Select cgMLST v2 + HierCC
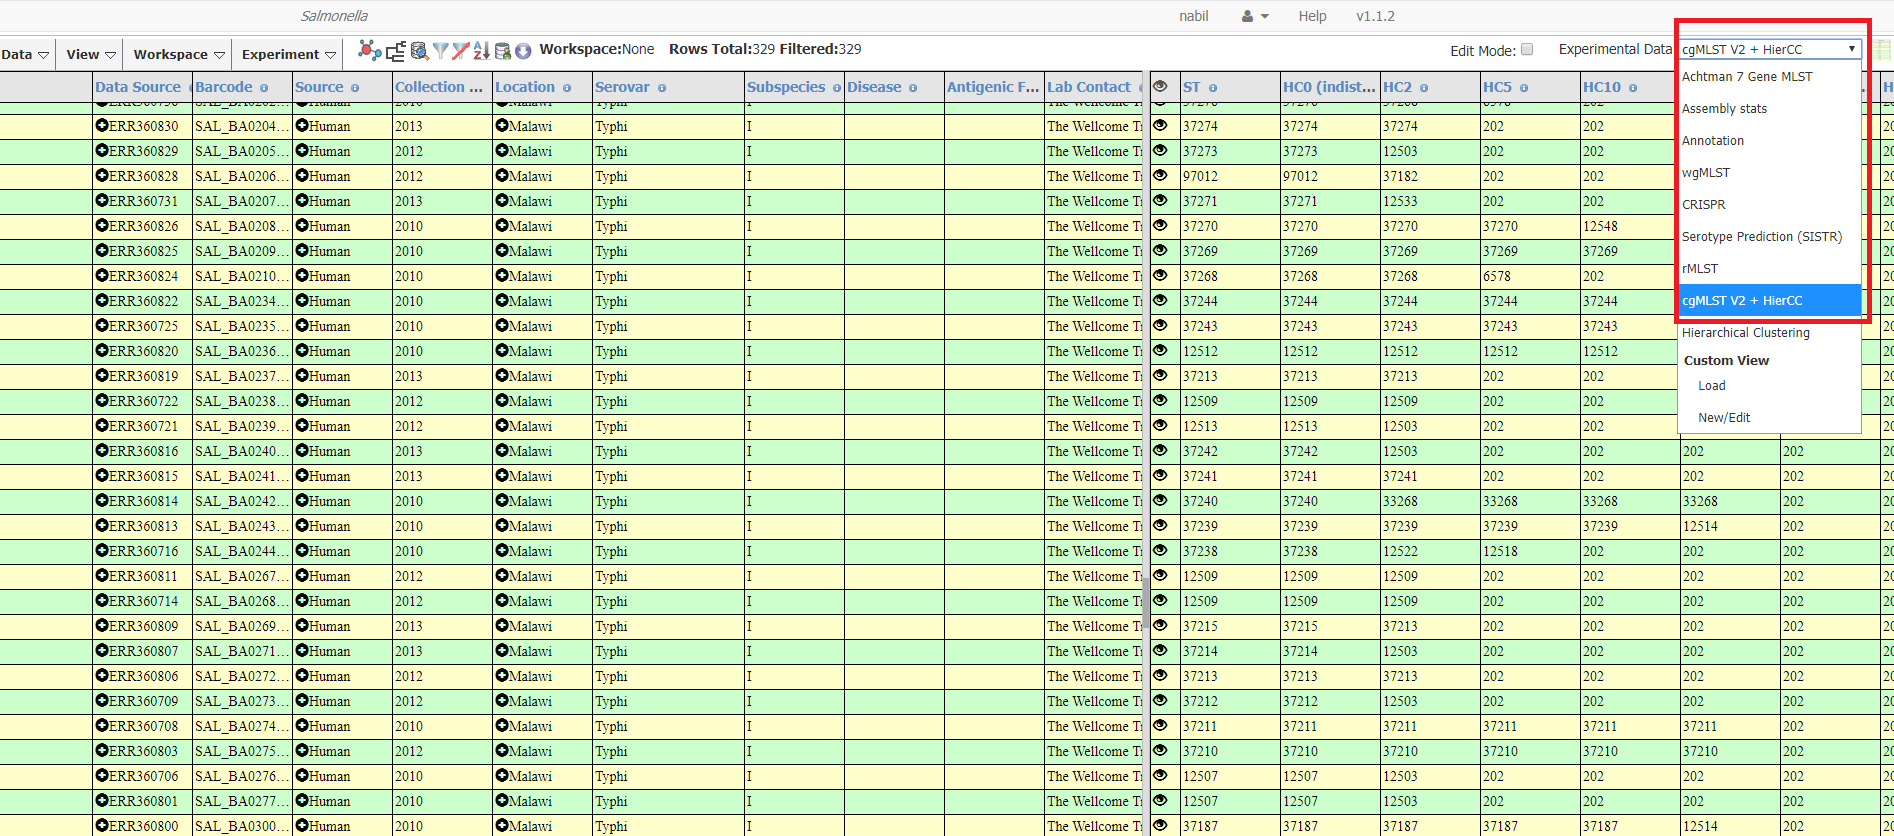
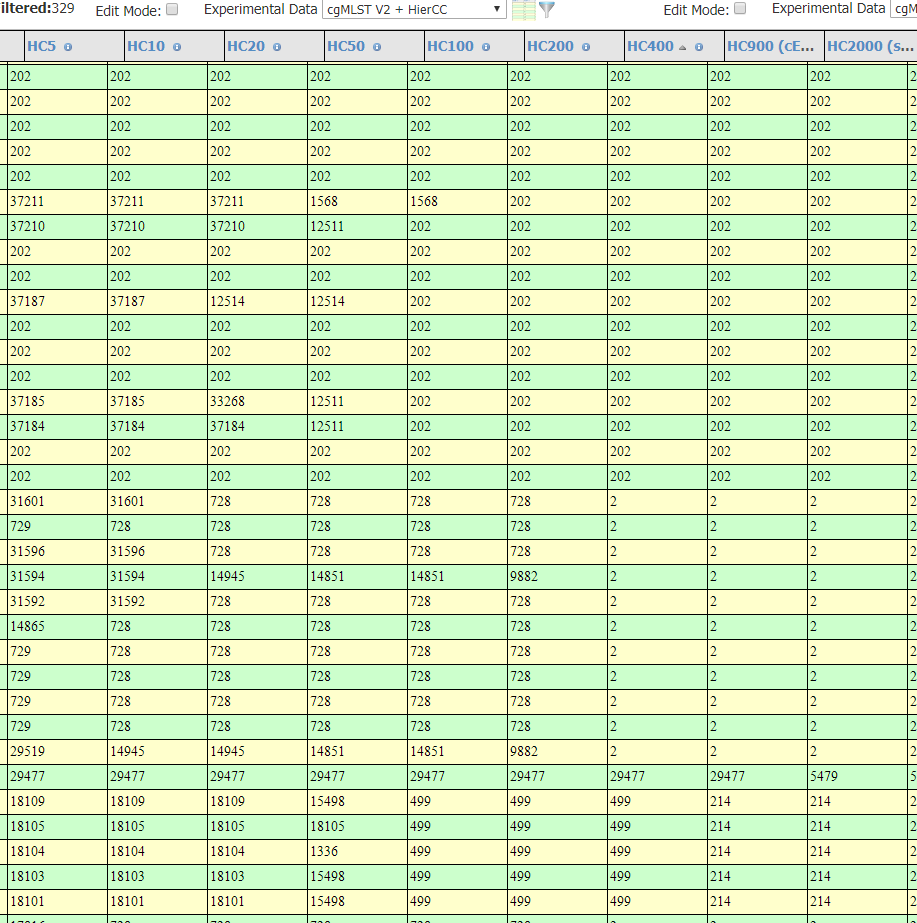
The HierCC results for this query are shown below as an example. Each column shows the cluster groups at different thresholds. The value for each genome is the cluster group ID.`HC5` means the clusters include all strains with links no more than 5 alleles apart.
It is important to remember that the number shown is the ID of the HierCC group and not of the allele distances and that these group IDs will not be consistent with STs of other genotyping methods like 7 gene MLST. So HC900:313 will not be the same as ST 313.
In the results example below, the HC400 is 2 which means all strains in this cluster have links no more than 400 allele apart. However, using HC50 some genomes are in HierCC HC50¦202 and some are HierCC HC50¦728. This means that these genomes are in seperate clusters when they are clustered on the criteria that all strains have links no more than 50 allele apart.
We will illustrate this with GrapeTree below.
Generating and annotating a tree based on HierCC
HierCC data can also be imported into GrapeTree figures, like any other experimental data. Let’s continue with the strains from Malawi as an example.
To generate a GrapeTree:
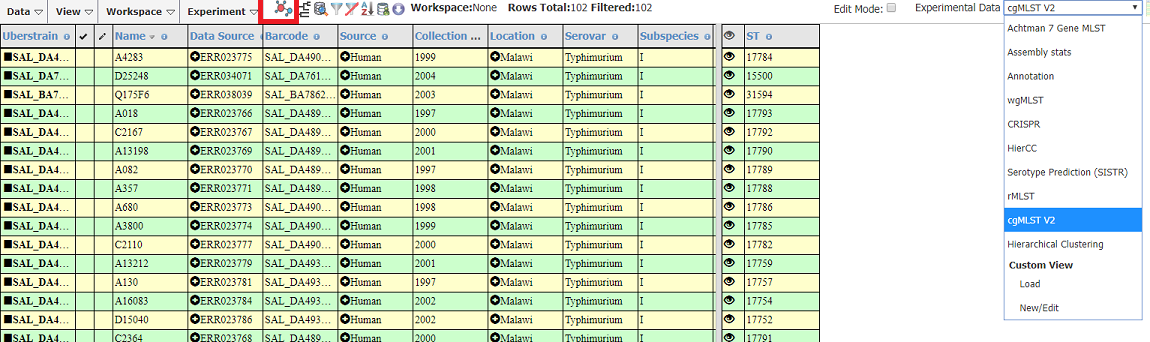
Select cgMLST under Experimental Data
Click the GrapeTree icon (highlighted in the red box below)
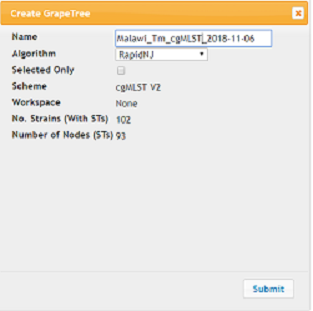
In the Create GrapeTree dialog:
Give your Tree a meaningful name under Name
Algorithm: RapidNJ
Click Submit
A new browser window will open up and it will take some seconds for the GrapeTree to be generated (Be sure to allow popups on your browser).
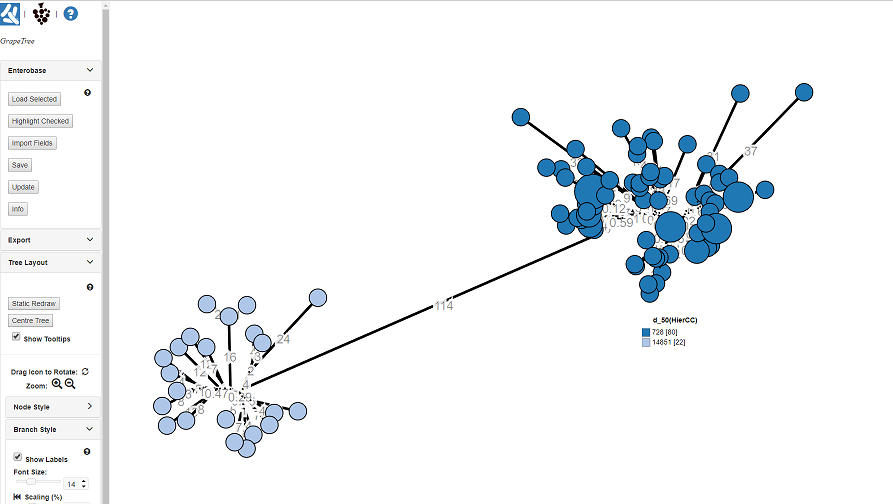
The GrapeTree here is annotate/colour-coded with the HC50 groupings. To do this on your own Tree, do the following:
Under the EnteroBase tab, click Import Fields.
In the Add Columns dialog:
Experiment should be MLST V2 + HierCC and Column should be HC50. Click
- Add.
‘HC50(MLST V2 + HierCC)’ should be added to the list of columns to import
- (on the right).
Click OK

This should update the GrapeTree with the HC50 groups. The key is labeled with the HierCC cluster ID; 728 & 14851, which we found in the previous section. You can clearly see the long branch (114 alleles) seperating the two groups.
Searching based on HierCC
The HierCC Cluster ID are searchable in EnteroBase if you want to quickly revisit a group of strains you found before. Using the Malawi example:
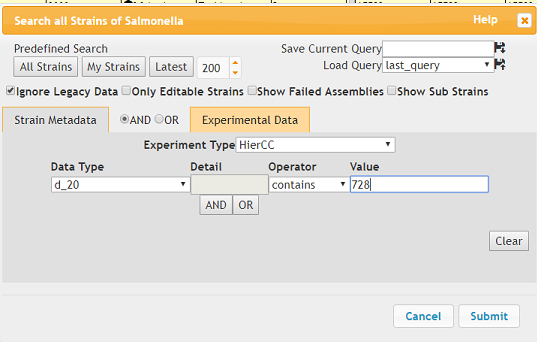
Use Search strains
Under Experimental Data:
Experiment Type should be MLST V2 + HierCC
Data Type should be HC20 where ST equals ‘728’.
Ignore legacy data should also be checked.
Click Submit
Some of the search results are shown below:
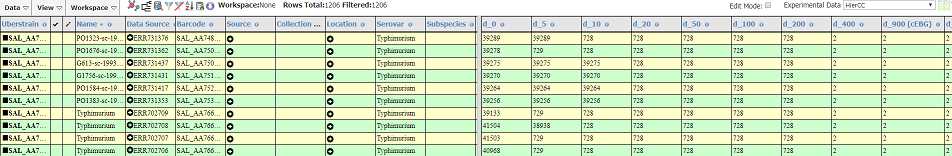
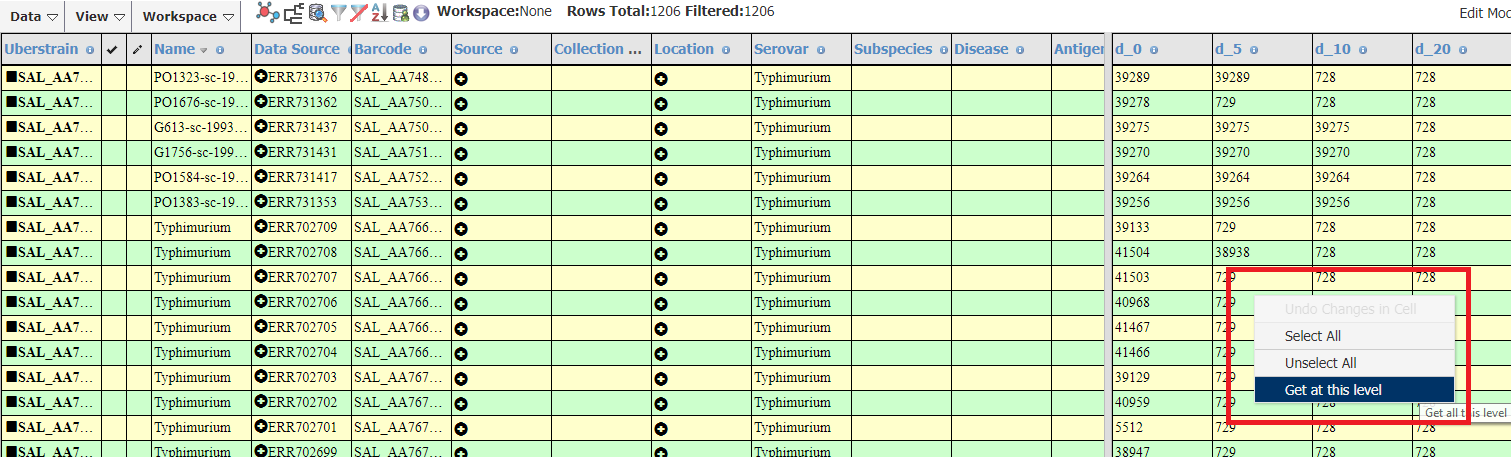
There is a short-cut for this process shown below. Right-clicking on the HierCC result for a given level will allow you to quickly search for strains in a given cluster.
On a particular cell in HierCC results:
Right-click
Click on Get at this level
In the example below, I clicked on HC5¦729 so the search results will be updated with all strains which are in cluster 729 (using HC5 as the threshold).