Tutorial 1A: Basic Usage of GrapeTree (EnteroBase version)
The procedure for working with GrapeTree in EnteroBase and stand-alone are identical, once you have loaded your data. This tutorial assumes you are using EnteroBase. There are other tutorials specifically for the Stand-alone version.
You will need to be a registered user of EnteroBase, see Getting Started - Registering and logging in.
About this dataset
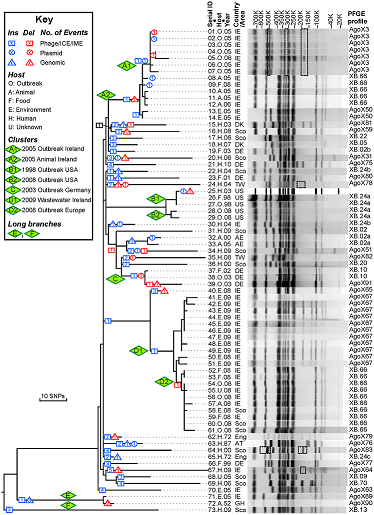
To learn the basic usage of GrapeTree we will be using data presented in Zhou et al. “Neutral genomic microevolution of a recently emerged pathogen, Salmonella enterica serovar Agona”. PLoS genetics 9.4 (2013): e1003471. We will try to replicate the tree presented in Figure 1, which shows phylogeny of serovar Agona including a number of outbreaks (green diamonds) across the world.
1. Searching EnteroBase
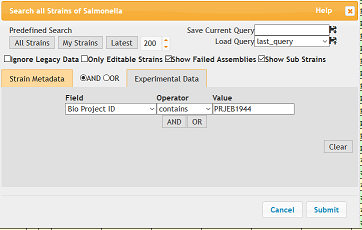
This tutorial assumes you are already familiar with finding records in EnteroBase. If you are not, please read Searching EnteroBase. In the case of this example, the genomes are listed under Bio Project ID PRJEB1944.
Perform the search in EnteroBase. This will load 71 records.
- Show sub strains box should be checked
- Search terms should be Bio Project ID (Field) contains (Operator) PRJEB1944 (Value)
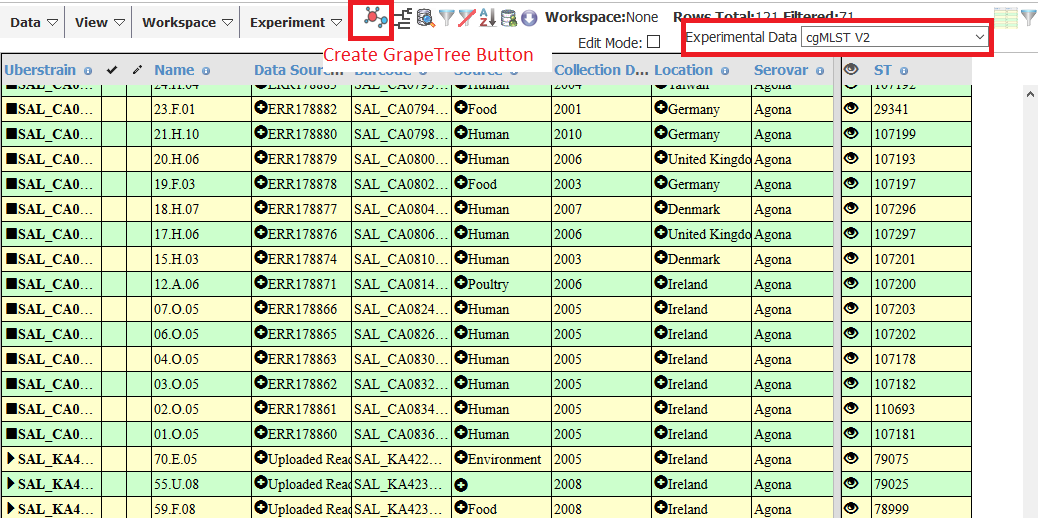
- From the Experimental Data dropdown on the right select cgMLST
- Click the Create MSTree button, once the cgMLST data has loaded.
- Leave the Algorithm option as MSTreeV2 and give the tree a title and click Submit.
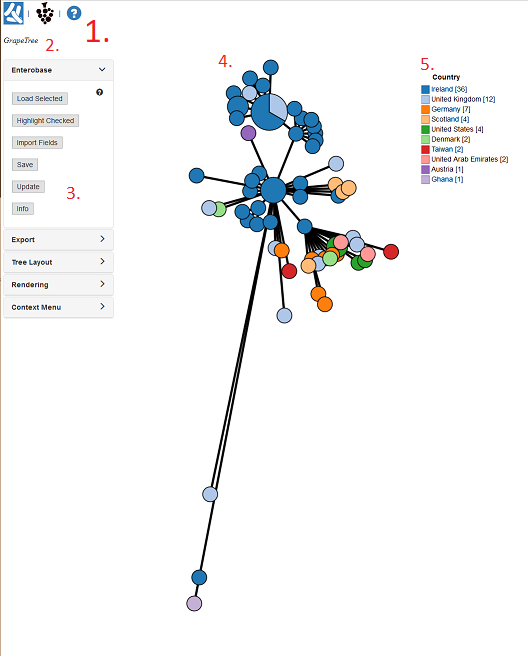
Make sure your browser allows pop-ups for EnteroBase! You should now have a new window open showing a tree similar to the one below.

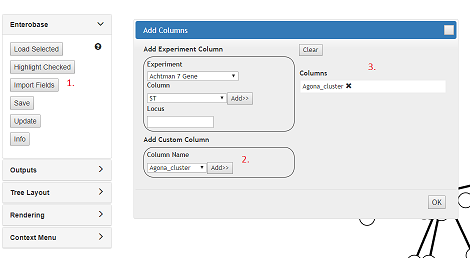
Before we get to far ahead, there is some custom metadata that describes the outbreak clusters from the paper. To load it, Open the EnteroBase panel:
- Click import fields
- Under “add custom column” select ‘agona_cluster’ and click add
- agona_cluster should show up in the column list on the right. Click OK
2. Basic Orientation
Let’s stop and orientate ourselves with the GrapeTree interface:
- These are links to important webpages (Top left). The Left icon opens a new browser page to EnteroBase, while the right opens the GrapeTree GitHub page.
- The text here (Top left) shows may show the filename of the file we just loaded in.
- This set of panels (Left) contains all the options for customizing our tree. Currently the Input/output panel is open and gives options to load trees/profiles, load metadata, and options to save our work.
- The GrapeTree Tree itself (Centre), the figure is interactive. Each circle is a Node and each line is a branch. Node size is dependent on the number of strains within that node. Branch length varies on the distance between nodes.
- The Key/Legend (Right) for the colour coding. You can change some settings by right clicking on it.
5. Basic Navigation
GrapeTree has a rich suite of tools to help you navigate and manipulate your tree. Try these out!
- If you get lost click Centre Tree under Tree Layout. Click Tree Layout to open or close the Layout panel.
- If you’ve messed up the tree Click Static Redraw under Tree Layout to reset the layout.
- Zoom in/out using the mousewheel or the Zoom buttons under Tree Layout. Click Tree Layout to open up the Layout panel and then click the magnifying glass (+) to zoom in or magnifying glass (-) to zoom out.
- Move the Tree by click & hold on any of the whitespace around the tree, and then drag.
- Move a node and its children by Click and holding the left mouse button down on a Node and then drag.
- Move the key/legend by Click and holding the legend and then drag to move it around.
- Rotate the entire tree by Click and holding the root node and then drag.
- Select some nodes by holding SHIFT key and dragging over some nodes in the tree. You can also select individual nodes by holding the SHIFT key and clicking on nodes one-by-one.
- Add more nodes to your selection by holding SHIFT key and dragging over other nodes in the tree.
- Deselect some nodes by holding SHIFT key and dragging over some already selected nodes. Try removing nodes from your current selection.
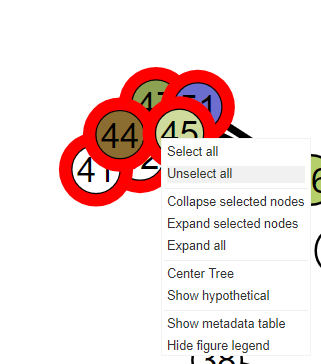
- Deselect all selected Nodes by double-clicking any whitespace around the tree, or by right-clicking and choosing Unselect all from the contextual menu.
This is enough to get started, let’s tidy up our tree.
6. Modifying the Tree Layout
The Tree Layout panel allows global changes to tree layout, nodes and branches and has some important navigation features. Try playing around with each of the settings to see what they do. Generally:
- You can drag the sliders to change the value.
- You can also directly modify the value by clicking on the value box, typing in a new value, and pressing enter or clicking out of the box.
- Click the refresh icon (the rewind icon) to reset the value to default.
Specifically under Tree Layout > Branch Style:
- Scaling: will uniformly increase the scaling for all branches. For instance, setting it to 200% will double the length of all branches relative to the default setting (100%); whereas 50% would halve it.
- Collapse Branches: will collapse all branches under a certain length. The length value shown is the real branch length for the tree. To see the lengths for all branches, check the Branch Labels under Branch Style. The slider is scaled relatively, so moving it all the way to the right will collapse all the nodes giving you a pie graph.
- Log Scale: if this is checked (has a tick in the box), all branches will be Log-scaled. This is useful for trees with a wide variety of branch lengths.
Specifically under Tree Layout > Node Style:
- Node Size: will uniformly increase the scaling for all Nodes. For instance, setting it to 200% will double the size of all Nodes relative to the default setting (100%); whereas 50% would halve it.
- Node Scaling: This will exaggerate differences in node size. In the case of the of the Agona dataset, all nodes include only one strain so there will be no effect.
For this tutorial set the Branch length to 150% (as shown below) and we shall continue.
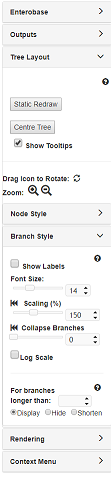
7. Styling the Branches
Under Branch Style we can also modify the look of the Branches in our Tree. We can show branch labels by checking the Branch Labels option and change the font size with the Font Size slider or by entering a new value in the box. If the Mouseover info box is checked we can see the branch length when we have the mouse cursor over a particular branch.
The tree of the Agona dataset has very long branches. Enter 100 in the box next to For branches longer than and set it to ‘Shorten’. This will shorten the branch length and change the line to be dashed, which indicates the branch length is not to scale.
8. Node settings
Under Tree Layout > Node Style we can modify the look of the Nodes in our Tree. We can show nodes labels by checking the Node Labels option and change the font size with the Font Size slider or by entering a new value in the box. If the Mouseover info box is checked we can see details for that node when we mouse over.
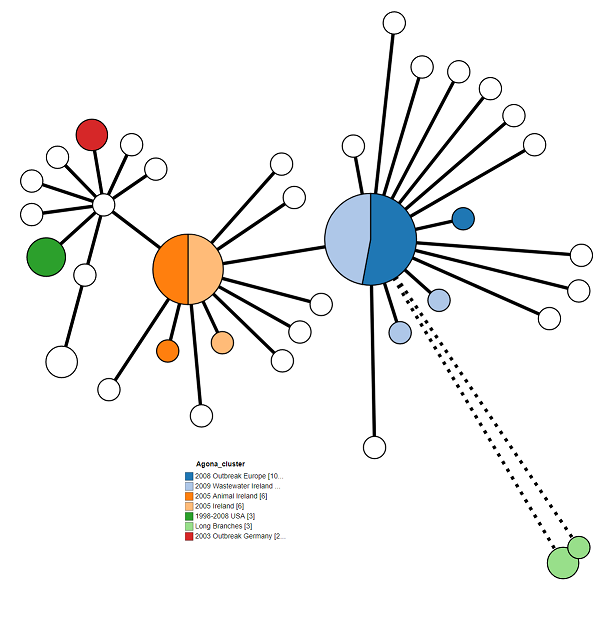
We can also set the colour coding of the Nodes. For the Agona dataset, Set Colour by to “Agona_Clusters” to show the outbreaks as defined the original paper. See if you can your figure to look like mine.
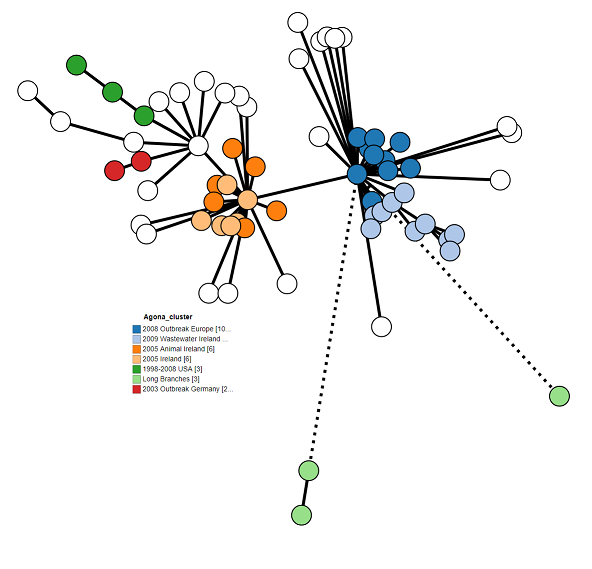
9. Final modifications
The tree is looking pretty good, but we can make it a bit clearer. Try playing around with all of the different options to come up with the best looking tree. Here’s what I came up with:
These are my settings:
- Tree Layout > Branch Length: 150%
- Tree Layout > Collapse Branches: 10
- Branch Style > Shorten branches longer than: 100
- Node Style > Colour by: Clusters
- Node Style > Node Labels: Unchecked/Off
10. Exporting our work
Your tree can be save in either GrapeTree’s JSON format, as a Newick tree that can be loaded into other phylogeny programs and as a Scalar Vector Graphic (SVG), which is an image format that you can edit in publishing software like Inkscape or Adobe Illustrator. If you would like a raster image (JPEG, PNG, BMP) of the Tree, just use the screenshot feature of your computer.